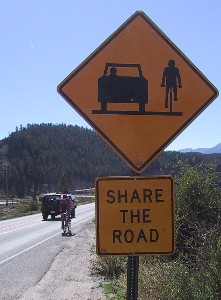
Posts Tagged ‘Safety’

Less safe roads for bikes and peds

Wednesday, April 7th, 2010

SEMCOG issued a press release highlighting their analysis of the 2009 crash data. When it comes to their non-motorized crash analysis, we find it to be very superficial. This year is no different.

We did more year-to-year comparison and found some unreported and disturbing trends.

What SEMCOG says: “Bicycle crashes down - Traffic crashes … involving bicycles decreased just less than one percent in 2009 from 2008. There were … 967 crashes involving bikes in 2009.”

What the data shows: While there were fewer total bicycle crashes, that is primarily due to there being fewer minor crashes that left the bicyclist uninjured. Incapacitating injuries among cyclists increased significantly. The number of serious (fatal or incapacitating) bicycle crashes are up over 16 percent!

This is especially alarming given that statewide bicycling fatalities are down 24%. And, motorist fatalities within the SEMCOG region dropped by 5%.

In 2009, 47% percent of all Michigan bicycle fatalities were within the SEMCOG region as opposed to 36% in 2008.

The number of bicyclists involved in a crash increased slightly this year as well.

What SEMCOG says: “Pedestrian crashes down - Crashes in Southeast Michigan involving pedestrians totaled 1,180 in 2009; this represents a two percent decrease from 2008.”

What the data shows: While pedestrian crashes are down, pedestrian fatalities are up 4.5%. Statewide, pedestrian fatalities are up 6.1%.

In 2008, non-motorized fatalities made up 21% of all road fatalities within the SEMCOG region. In 2009, that percentage climbed to 23%.

Also in the press release, SEMCOG Executive Director Paul Tait says, “We are happy to report this continuing decline in traffic crashes in Southeast Michigan. A number of factors contribute to this downward trend, including the poor economy, higher gas prices, fewer vehicle miles traveled, and higher safety belt usage.”

If higher gas prices and fewer vehicle miles traveled meant safer roads in 2009, then why aren’t those goals within the Michigan’s Strategic Highway Safety Plan? It’s obvious that one of the most efficient ways of decreasing serious road injuries would be to reduce the vehicle miles traveled. It’s proven itself in 2009, yet it’s not part of the plan to improve road safety. Why not? Is the lack of political leadership trumping safety?

And, SEMCOG’s Camine Palombo commented on their analysis by concluding, “Finally – some news we can be proud of!”

We don’t agree.

MDOT Transportation Enhancements

Sunday, March 7th, 2010

First the good news. MDOT recently made the following Transportation Enhancement (TE) awards that should improve bicycling in Metro Detroit.

From MDOT’s press release:

Macomb County

The city of Utica will construct a nonmotorized bridge over the Clinton River to provide accessibility and connectivity to the city of Utica’s portion of the bike trail that will connect the Huron Clinton Metroparks at Metro Beach and Stoney Creek. The project is part of the Macomb County Bike/Hike Master Plan and will allow bicyclists to connect to the Macomb Orchard Trail as well as the Clinton River Trail in Oakland County. The project cost is $452,525, including $303,192 in federal TE funds and $149,333 in matching funds from the city.

Macomb, Oakland, Wayne counties

SMART, in coordination with its community partners, will purchase and install bike racks at several locations in Wayne, Oakland and Macomb counties. The intent is to provide communities with secure bike racks at locations away from bus routes for the convenience of SMART riders who also ride bikes. The project cost is $20,016, including $16,013 in federal TE funds and $4,003 in matching funds from SMART.

Clawson is also getting bike racks installed along 14 Mile Road. Unfortunately they only seem willing to make mild improvements to walkability and even milder ones for bike-ability. Their conceptual plans for their Main Street road diet included bike lanes. Their final plans and implementation did not.

MDOT Five-year plan

MDOT recently released their five-year spending plan. With reduced revenue from people driving less, Michigan cannot provide the full 20% match for federal transportation funding.

This does affect the Transportation Enhancements program. Normally MDOT would provide $12 million in match for TE projects on their roads. That may be reduced to $1 million per year, which means MDOT will undertake fewer TE projects like paved shoulders, bike lanes, and streetscaping on MDOT state trunklines.

However, it also means that local governments will received more TE funding since they provide the match and not MDOT.

It’s also worth highlight this language within MDOT’s plan. This provides useful quote for cycling advocates in Michigan.

Pedestrian and bicycle transportation are on the rise due to increased fuel costs. Injury and fatality statistics are humbling reminders of the importance to design and build safe facilities for multiple modes of transportation and of the importance of education and enforcement.

It may be surprising to some that in Michigan, one pedestrian is injured every three hours and 59 minutes and one bicyclist is injured every five hours and 13 minutes.

In addition, in 2006, 17.9 percent of the 1,002 traffic fatalities in Michigan were bicyclists or pedestrians, whereas nationally, 11.6 percent of the 42,642 traffic fatalities were bicyclists or pedestrians. A reduced [Transportation Enhancements] program would severely jeopardize MDOT’s ability to provide safer pedestrian and bicycle facilities.

This does raise one question.

If 17.9% of road fatalities are non-motorized users, why did the Michigan Office of Highway Safety Planning only allocate 0.36% for non-motorized safety under the State and Community Highway Safety Grant Program in 2009?

Toyota fatalities? What about Metro Detroit bikes and peds?

Thursday, February 18th, 2010

What do the numbers 34, 39, and 339 represent?

Thirty-four is the number of fatalities being attributed to “sticky” Toyota gas pedals nationwide since 2000. It’s causes a media uproar, NTSA reviews, and public outcry over safety.

Thirty-nine is the number of cycling fatalities between 2000 and 2008 within Oakland, Wayne, Macomb, and St. Clair counties.

Three hundred, thirty-nine is the number of pedestrian fatalities during this time and within these same counties.

The difference with the local fatalities? There’s no uproar and very little media coverage. Agencies like the Road Commission for Oakland County continue to ignore best practices and AASHTO design guidelines for bicycle facilities.

Imagine if Toyota was caught ignoring best safety practices? This that would get some media coverage?

[This post was inspired by articles on Los Alamos Bikes and How We Drive.]

Liberty Mutual rewrites road safety history

Monday, February 8th, 2010

Volume 13 Issue 1 of Libery Mutual’s Liberty Lines magazine includes a timeline called “Model T to Infiniti: 100 Years of Safety Innovations.”

The timeline’s introduction states that “…because of ever-increasing safety innovations, the rate of fatalities has decreased.”

That’s a pretty misleading if not dishonest statement.

Liberty Mutual’s timeline begins in 1900 when fatalities due to automobiles was a rarity nationwide. By 1907 there were roughly 500 fatalities (fewer than 6 fatalities per million Americans) which grew sharply over time.

There were over 37,000 people killed in 2008 (more than 120 fatalities per million Americans.)

That’s not a lower rate.

Perhaps the fatality rate per 100 million vehicle miles travel has dropped with people driving more, but that’s hardly something to celebrate when we lose the equivalent of a medium-sized U.S. city of people every year.

And about 14% of those fatalities are pedestrians and bicyclists. Looking at a rate based on vehicle miles travel only serves to hide these fatalities.

[The road fatality chart was published in Peter Norton's excellent book, Fighting Traffic.]

How do you define “safe”?

Saturday, January 23rd, 2010

The following was posted during a discussion on living car-free in Detroit on bikeforums.net (emphasis ours):

Ahh, the myth that the metro area is all Detroit. I live in a very nice suburb that is quiet and safe. The only reason I feel the need to leave here is just so I can depend less upon a motorized vehicle and more upon my own power. The car culture here is strong and the roads are just not safe for riding everywhere I would like to be able to go.

So which is it? The suburb is safe but the roads are not safe?

From a cyclist perspective, if the roads aren’t safe, your community isn’t safe. Cycling advocates shouldn’t let local governments view safety only from behind a windshield.

But surely suburbs do have lower reported crime rates compared with Detroit. Then again, having a motor vehicle on their horn and passing unsafely is?assault with a deadly weapon, though it’s rarely reported.

It does seem Detroit’s streets are safer for cycling — a conclusion supported by the average yearly bicycle crashes per 100K residents from 2004 through 2009.

Detroit 16.5
St. Clair County 18.9
Oakland County 19.4
Wayne County (without Detroit) 25.0
Macomb County 26.1

Also, Detroit has the lowest bicycle crash rate despite having a highest bike to work rate.

And as for living car-free, it would be tough to beat Detroit’s Corktown neighborhood.